Ask ten traders how they analyse a trade and you'll get ten different answers, most of them some version of "I look at the chart and see if it feels right." That works until it doesn't, and when it stops working there's nothing to debug, because nothing was structured in the first place.
Good trading analysis isn't a talent. It's a repeatable sequence of questions you ask in the same order every time, so that decisions come from a process rather than from mood. This guide lays out that framework, the mistakes that undermine it, and where modern tools can speed it up.
What "trading analysis" actually covers
The term gets used loosely, but it generally spans three layers, and strong analysis usually touches all three:
- Technical analysis — reading price, structure, levels, patterns, momentum and volume to understand what the market is doing and where it may go next.
- Fundamental and contextual analysis — understanding the drivers behind the instrument, such as earnings, economic data, interest rate expectations, or scheduled events that can change volatility abruptly.
- Behavioural analysis — reviewing your own decisions: why you entered, whether you followed your plan, and what patterns show up in your mistakes.
Most beginners focus almost entirely on the first layer. Experienced traders tend to spend just as much time on the third, because it's the one layer entirely within their control.
Building a repeatable analysis checklist instead of relying on gut feel
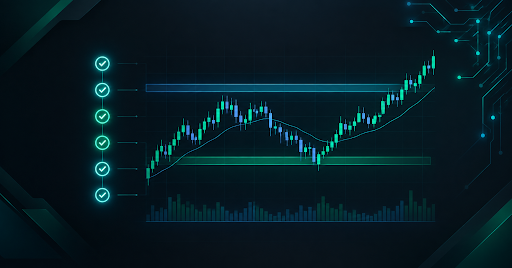
A checklist sounds boring, and that's the point. It removes the room for improvisation on days when you're tired, impatient, or chasing a loss. A workable structure follows this order:
- Context. What's the higher-timeframe trend and structure? Are you trading with it, against it, or in a range?
- Levels. Where are the meaningful support and resistance zones, and how close is price to them?
- Setup. Does the current price action match a defined setup you've tested, or are you improvising?
- Confirmation. Does volume, momentum, or order flow support the idea, or is it contradicting it?
- Risk. Where is the invalidation point, how large is the position, and is the reward worth the risk?
- Events. Is there scheduled news that could distort the trade before it plays out?
If a trade can't clear all six steps, the default answer is to pass. Most losses come from trades that skipped one of them.
How to weigh conflicting signals without freezing up
Signals rarely align perfectly. Trend might be up while momentum is fading, or a clean pattern might sit right under a major resistance level. Two habits help:
- Rank your inputs. Decide in advance which factors carry the most weight for your style. For many traders, higher-timeframe structure outranks a short-term indicator reading.
- Treat conflict as information. Mixed signals usually mean lower conviction, which should translate into a smaller position or no trade at all, not a coin-flip decision.
The goal isn't to eliminate uncertainty. It's to make sure uncertainty shows up in your position sizing rather than being ignored.
Common trading analysis mistakes — overfitting a narrative to the chart
The most damaging error in analysis is deciding what you want to happen and then finding evidence for it. Once you're emotionally invested in a direction, every candle starts to look supportive. Watch for these patterns:
- Confirmation bias. Noticing only the signals that agree with your existing view.
- Indicator stacking. Adding tools until something agrees with you, which produces the appearance of confluence without adding real information.
- Hindsight pattern-spotting. Seeing a "perfect" pattern after the move has already happened, then expecting to recognise it as clearly in real time.
- Skipping the review. Never checking whether your analysis was actually right, so the same weaknesses repeat.
A useful check before any trade: write down what would prove your analysis wrong. If you can't name it, you're probably not analysing, you're hoping.
How AI trading tools are changing the analysis process
Working through context, levels, setup, confirmation and risk on every chart is thorough, but slow, especially while you're still building the skill. This is one area where AI trading tools have become genuinely useful, not by predicting outcomes but by speeding up the structural read so you spend more time deciding and less time scanning. We cover more of these tools and techniques on the TickForge blog.
The important distinction is between tools that describe what's on the chart and tools that claim to tell you what will happen next. The first kind is a time-saver and a useful second opinion. The second kind should be treated with heavy scepticism, because no tool can reliably predict short-term price movement. Use AI to structure and speed up your analysis, then apply your own judgment about whether the trade fits your plan and risk limits.
A simple pre-trade analysis checklist you can start using today
Copy this into a note and run through it before every trade this week:
- What's the higher-timeframe trend, and am I with it or against it?
- What are the two nearest levels, and how far away are they?
- Does this match a setup I've defined and tested?
- What confirms the idea, and what contradicts it?
- Where exactly is my invalidation, and what's my position size at that stop?
- Is there scheduled news in the window this trade needs to play out?
- What would prove my analysis wrong?
After each trade, add one line: did I follow the checklist? That single habit, tracked over a few weeks, tells you more about your results than any indicator will.
TickForge is free to start. Upload any chart to AI Lens for an instant structural read, and use it as a fast second opinion while you build your own analysis process. No card required.
Analyse your first chart free with AI Lens →
FAQ
- What is trading analysis?
Trading analysis is the process of evaluating a market or instrument to decide whether, when and how to trade it. It typically combines technical analysis of price and volume, contextual analysis of events and market drivers, and a review of your own behaviour and decision quality.
- What are the main types of trading analysis?
The three most common are technical analysis (charts, price action and indicators), fundamental analysis (economic data, earnings and valuation) and sentiment or behavioural analysis (positioning, market mood and your own decision patterns). Most active traders lean primarily on technical analysis while using the others for context.
- How do I make my trading analysis more consistent?
Use a written checklist that you follow in the same order every time, covering trend and context, key levels, setup, confirmation, risk and upcoming events. Consistency comes from removing improvisation, and tracking whether you followed the checklist on each trade shows where the process breaks down.
- Can AI do trading analysis for me?
AI tools can reliably speed up parts of the process, such as identifying trend, structure, levels and patterns on a chart. They work best as an assistive second opinion. No AI tool can dependably predict short-term price movements, so the decision to trade and how to manage risk should remain yours.
- Is technical analysis or fundamental analysis better?
Neither is universally better. Technical analysis is generally more useful for timing entries and exits over shorter horizons, while fundamental analysis is more useful for understanding longer-term value and event risk. Many traders combine both, using fundamentals for context and technicals for execution.