Deterministic by design
The seed is derived from the instrument, exchange, date range, timeframe and requested pattern — the same request always rebuilds the exact same session, for you and for everyone you share it with.
TickForge flagship AI suite
AI Lens chart analysis · Shield order-flow intelligence · private screenshot reads · educational insights in seconds.
Two specialist AI tools, built for two different views of the market. Use AI Lens for price structure, patterns and scenarios. Use Shield for liquidity, absorption, imbalance and institutional-trap context. Your images are analysed in memory and never saved.
Educational analysis only, never investment advice. Your screenshot is read in memory and never stored.
The two features at the core of TickForge
New — Vega Anywhere
Add the Vega extension to Chrome, Edge, Brave, Arc or Opera. Capture whatever chart is on your screen and get the same AI Lens technical read or Shield order-flow read — then ask follow-up questions in plain language. Included with every TickForge plan.
Educational chart reading only — Vega never issues trade calls, and nothing you capture is stored.
How it works
New — AI Lens, the snapshot analyst
Drop in a screenshot of any chart you are staring at and AI Lens reads it like a senior technician: trend and structure, graded support and resistance, patterns with their measured move, candle signals, momentum and volume — then three scenarios with probabilities and teaching setups with entry, stop, targets and reward-to-risk. Every read is an educational example, never advice.
Private by design. Your screenshot is read in memory and dropped with the request — nothing is stored, and nothing is attached to your profile.
Sample read
Trend
Bullish
Momentum
Rising
Confidence
88%
Illustrative example of the AI Lens output format. Educational only — not a recommendation to buy or sell anything.
Liquidity
Above
Delta
Diverging
Auction
Failed
Illustrative output format. Shield explains order-flow evidence for education; it does not execute trades or issue signals.
Shield · institutional order-flow reader
Shield is the specialist desk for DOM, footprint, delta and volume-profile captures. It maps where size is resting, identifies absorption and imbalance, explains likely trap mechanics, and gives you a checklist for what would confirm or invalidate the read.
The engine
No vendor feed, no waiting on data downloads. The generator models the session itself — and because it is seeded from your request, the chart you shared with a student last month is the same chart they open today.
The seed is derived from the instrument, exchange, date range, timeframe and requested pattern — the same request always rebuilds the exact same session, for you and for everyone you share it with.
Each name carries researched volatility, gap behaviour, spread and volume character, and its spot is re-anchored to the real market every weekend, so a Tokyo bank and a US megacap never move alike.
Bars build tick by tick — wicking up and down until the bucket closes — while older candles roll left off the screen, exactly like watching an open market.
Volatility clustering, self-exciting news jumps, widening spreads, block prints, liquidity vacuums and stop-hunt wicks around round numbers, on each exchange's own session curve.
Markets
Indices and large caps across global markets — each on its own session hours, currency and tick size, with spot anchored near the real market.
Choose from markets worldwide, then browse indices, stocks, currencies, digital assets and commodities in one consistent practice workflow.
Session length, bar buckets and replay timestamps follow each selected market’s local opening hours, breaks and closing time.
Spot anchors refresh every Saturday morning once every exchange has closed its week, so charts stay near the real end-of-week close — and identical for every user through the week.
Prices, tick sizes and formatting adapt to each selected market’s own currency and number conventions.
Patterns
Put the patterns you are drilling on a watchlist and they get outlined the instant they complete. Pin any hit from the live feed to keep it on the chart, hover it for a plain-English note on what the structure signals, or inject a specific pattern and have the engine build a realistic session around it.
Meet Vega — your AI trading coach
Vega lives in the corner of your terminal. Ask anything in plain language — "show me a bull flag", "why is this head and shoulders invalid?", "walk me through position sizing" — and Vega forges a fresh session, marks the structure, draws the trendlines, zones and Fibonacci levels, and talks you through entry, invalidation and targets step by step. Every explanation is educational, on synthetic data, and never a recommendation to trade.
Vega is an AI educator. It explains chart mechanics on synthetic data and does not give investment, financial or tax advice, signals or recommendations.
Illustrative conversation. Charts referenced are synthetic, algorithmically generated simulations.
Vega in action
Real captures from a practice session. Every chart below was forged on the spot from synthetic ticks and annotated live by Vega while it talked the setup through.
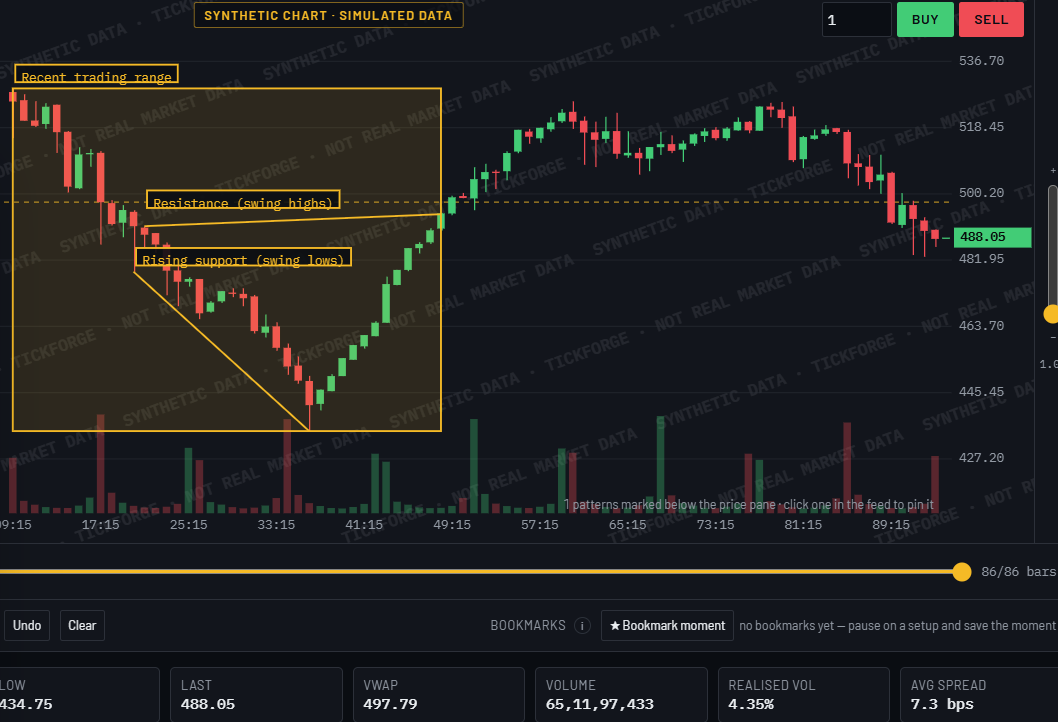
Ask about a range and Vega boxes it, labels the swing highs and lows, and drops the resistance line right where the tape keeps rejecting.
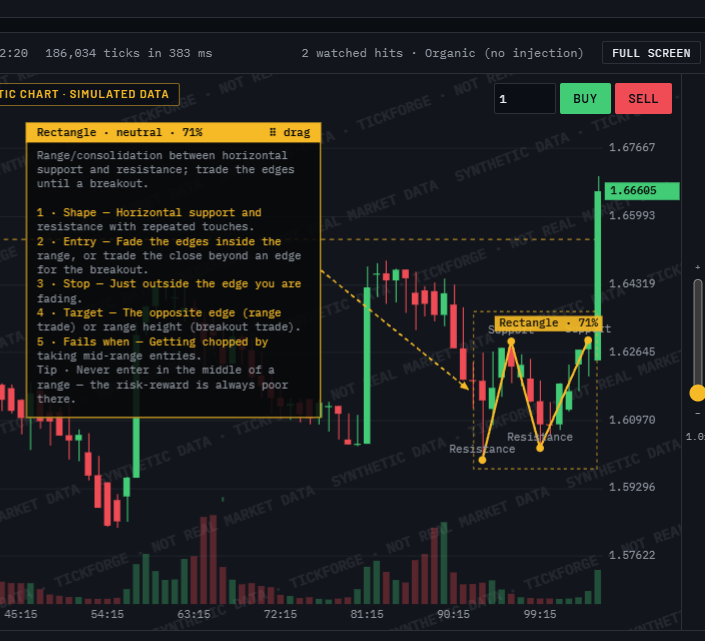
Shape, entry, stop, target, and the way it fails — pinned next to the marked formation, and draggable so it never hides your chart.
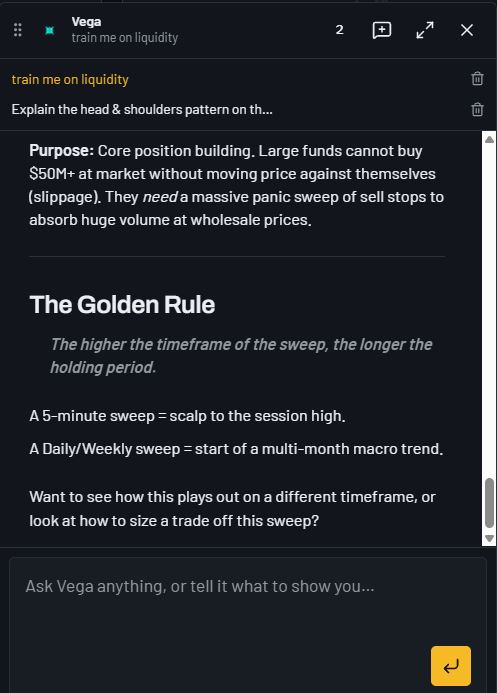
"Train me on liquidity" gets you why big money needs a stop sweep — not textbook jargon you'll forget by the next candle.
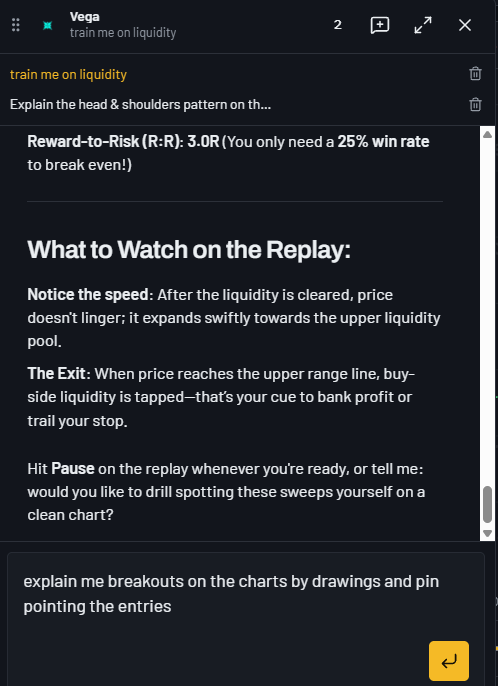
R:R spelled out, the exit called in advance, then Vega tells you exactly what to watch for as the ticks keep printing.
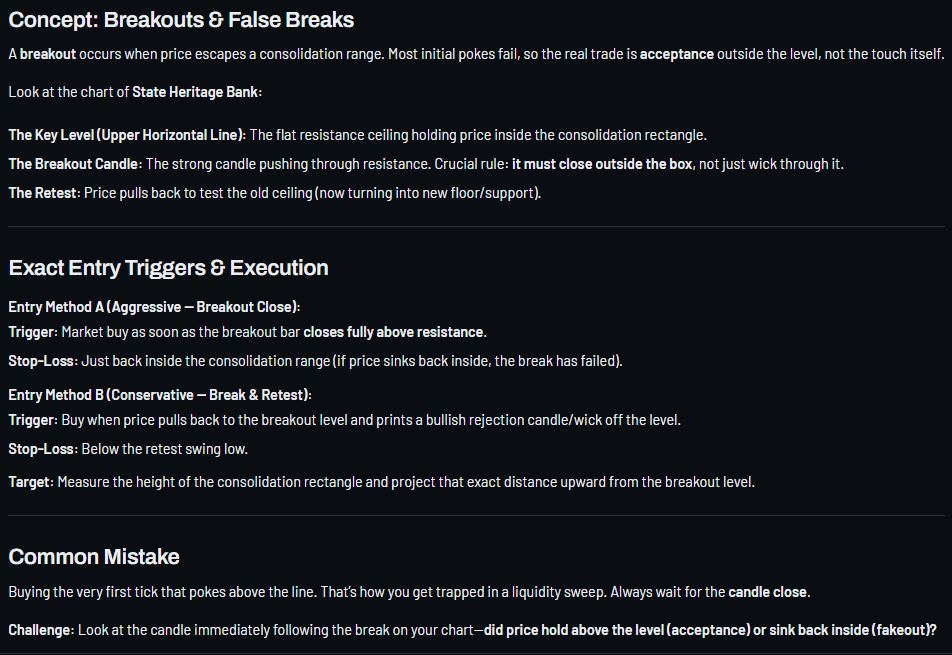
Aggressive versus break-and-retest, the trap that catches everyone, and a question back to you — so you practise reading, not watching.
Screenshots from the TickForge terminal. All charts, prices and volumes are synthetic, algorithmically generated simulations — not real market data, and nothing shown is investment advice.
Strategy simulation
Stack your own AND/OR conditions — price versus EMA, SMA or VWAP, RSI and ATR bands, volume surges, body and wick ratios, crosses, rising and falling streaks — save them to your account, and see every trigger marked on the chart as the replay runs. Then simulate the rulebook with stops, targets, slippage and costs.
Win rate
58.4%
Expectancy
+0.42R
Max DD
-6.1%
Sharpe
1.87
Illustrative figures from a sample simulated run on synthetic data. Your results depend on your rules and are not a forecast of real trading outcomes.
Your specialist AI desk is ready
Upload a chart for a structured technical read, or bring an order-flow capture to map liquidity and trap mechanics. Then take the lesson into the synthetic replay terminal.
Practice and education only. All charts are synthetic, algorithmically generated simulations — not real market data and not investment advice.