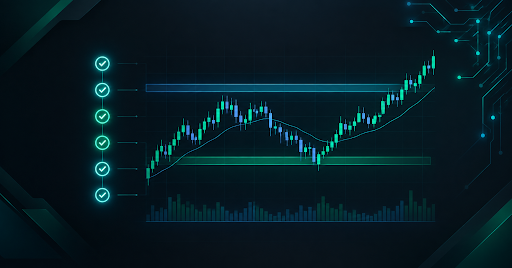
Open any trading chart and there's an overwhelming number of things you could look at — trendlines, dozens of indicators, patterns with names borrowed from geometry and astronomy. Most beginners either freeze from the options or overload their chart with indicators that end up contradicting each other. Good chart analysis doesn't start with more tools. It starts with a short, consistent sequence you run on every chart, in the same order, every time.
This guide covers that sequence — what to look at first, second, and third — and where AI-assisted tools genuinely speed the process up without replacing the judgment part.
Trend and structure — the foundation before anything else
Before anything else, chart analysis starts with one question: is this instrument trending, ranging, or transitioning between the two? Everything else you do on the chart should be read in that context, because a pattern or level means something different in a strong uptrend than it does in a choppy range.
Structure means identifying the sequence of higher highs and higher lows (uptrend), lower highs and lower lows (downtrend), or a lack of clear direction (range). This is usually visible on a higher timeframe than whatever you're trading, which is why most experienced chart readers check a daily or weekly view before dropping down to their entry timeframe.
Support and resistance — how to grade a level's strength
Support and resistance are the most commonly taught concept in chart analysis and also the most commonly misapplied. Not every level deserves the same weight. A level is generally stronger when it has:
- Been tested multiple times without breaking, showing repeated rejection.
- Round-number or psychological significance which tends to attract more orders.
- Confluence with other signals — a moving average, a prior swing high/low, or a volume cluster sitting at the same price.
- Recency — a level from six months ago carries less weight than one formed in the last few sessions, since market conditions shift.
Marking every minor wiggle as "support" or "resistance" clutters a chart and dilutes the signal from the levels that actually matter.
Classical patterns worth knowing
A handful of patterns show up often enough to be worth learning properly, rather than memorizing dozens of rare formations:
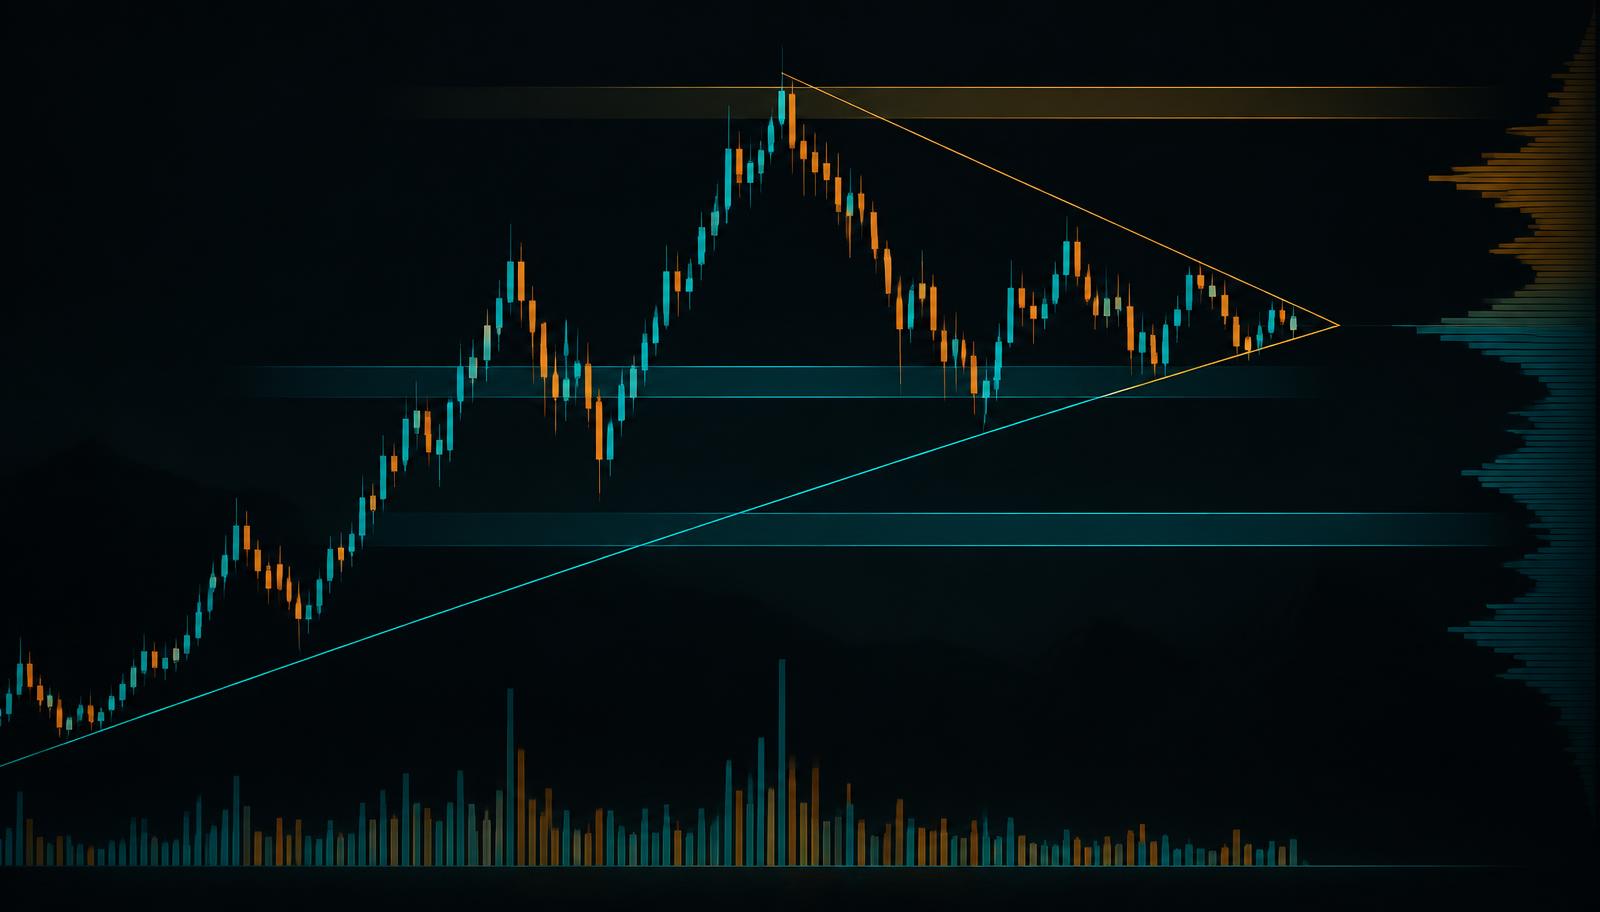
- Triangles — compression. Range narrows, volume usually falls, and the resolution tends to be quick.
- Flags and pennants — a pause inside a strong move, typically brief and shallow relative to the impulse.
- Head and shoulders — a failed attempt to extend a trend, where the middle push is not confirmed by the one after it.
- Double tops and bottoms — the market testing the same level twice and failing.
A pattern is a description of behaviour, not a prophecy. Its value comes from what it tells you about where the market has been indecisive.
Momentum and volume — confirming or doubting a setup
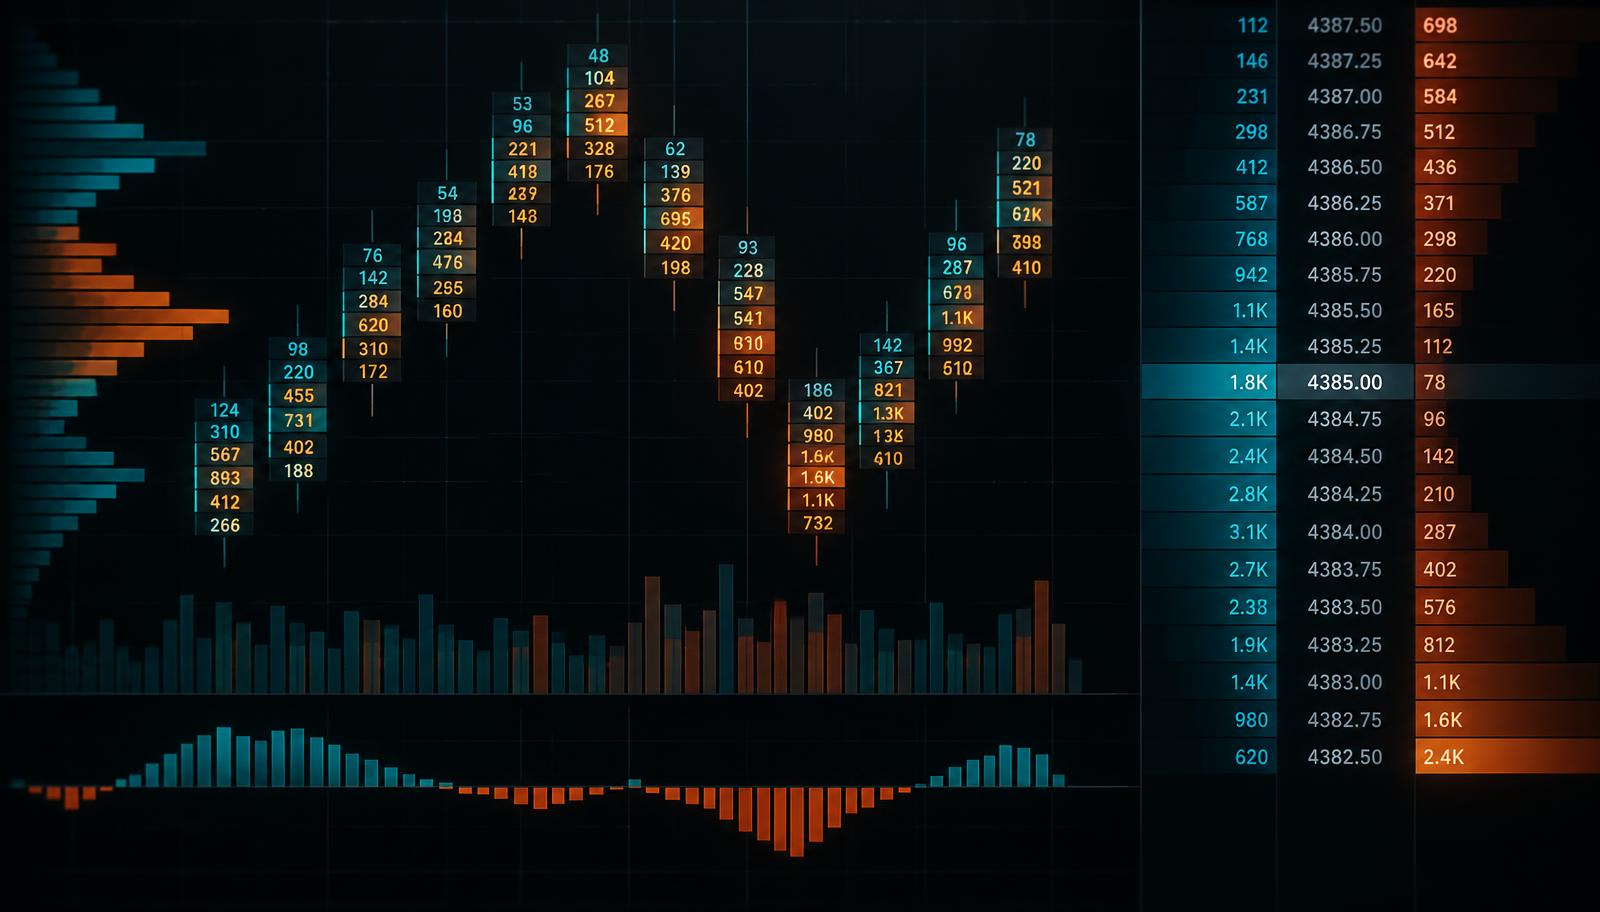
Price structure and patterns tell you where things might go; momentum and volume tell you how much conviction is behind the move. A breakout on rising volume carries more weight than the same breakout on thin volume. Divergence between price and momentum indicators (like RSI making a lower high while price makes a higher high) is often an early warning that a trend is losing steam, even before the chart pattern confirms it.
This step is where a lot of beginner chart analysis stops short — checking the pattern and level, but skipping the confirmation step that tells you whether the setup actually has support behind it.
How AI chart analysis speeds up the process
Running through trend, structure, key levels, patterns, and volume confirmation on every chart you look at is thorough — but it's also slow, especially while you're still building the skill and second-guessing each step. This is exactly where AI-assisted tools have become genuinely useful rather than just a buzzword.
Manually working through all of this on every chart is slow, especially early on. AI chart analysis tools like AI Lens can run the same structural read in seconds — trend, key levels, pattern recognition, and scenario probabilities — so you spend your time deciding whether you agree with the read and want to act on it, rather than spending ten minutes scanning the chart from scratch every time.
Practising chart analysis without real risk
The fastest way to get comfortable with chart analysis is repetition against outcomes you can actually check — reviewing a chart, making your read, and then seeing what happened next, without capital on the line while you're still building the skill.
TickForge's AI Lens is built for exactly this — upload any chart and get a structured breakdown of trend, structure, key levels, and patterns in seconds, which you can use either as a fast second opinion on your own read or as a way to practise and compare your analysis against a consistent baseline.
Analyse your first chart free with AI Lens →
FAQ
- What is the first step in chart analysis?
The first step is identifying the overall trend and structure — whether the instrument is trending up, trending down, or ranging — usually checked on a higher timeframe than the one you plan to trade. Every other element of chart analysis, including support/resistance and patterns, should be interpreted within that broader context.
- What's the difference between technical analysis and chart analysis?
Chart analysis generally refers to the visual reading of price action, structure, and patterns on a chart. Technical analysis is the broader discipline, which also includes indicators, quantitative signals, and sometimes intermarket or statistical analysis beyond just what's visible on the chart itself. In practice, the terms are often used interchangeably.
- Can AI accurately analyse trading charts?
AI chart analysis tools can reliably identify structural elements — trend direction, support/resistance levels, and classical patterns — consistently and quickly. They're best used as an assistive second opinion or a faster starting point for your own analysis, rather than as a standalone signal to trade on without your own judgment.
- How long does it take to get good at chart analysis?
Recognizing basic trend, structure, and common patterns can be learned within a few weeks of focused practice. Developing the judgment to weigh conflicting signals and read context accurately — which is where real skill shows up — typically takes several months of consistent, deliberate practice across varied market conditions.
- Do I need multiple indicators for good chart analysis?
No. Effective chart analysis relies more on a consistent process — trend, structure, key levels, patterns, and volume confirmation — than on stacking numerous indicators. Adding too many indicators often creates conflicting signals and can slow down decision-making rather than improve it.