The first time most traders open an order flow chart, it looks like a wall of numbers with no obvious starting point. Candlestick charts are intuitive — price goes up, price goes down. An order flow chart shows something different: not just where price went, but who was trading it and how aggressively. That extra layer is powerful once it clicks, but it's also why most beginners bounce off it within a week.
This guide breaks down what an order flow chart actually shows, the core chart types you'll encounter, and how to start reading one without needing a finance degree.
What an order flow chart actually shows vs. a regular price chart
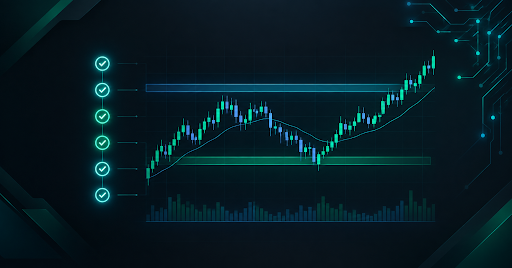
A regular candlestick chart is a summary. It tells you where price opened, how far it travelled and where it closed. Everything that happened inside that candle — who was buying, who was defending, who gave up — is compressed away.
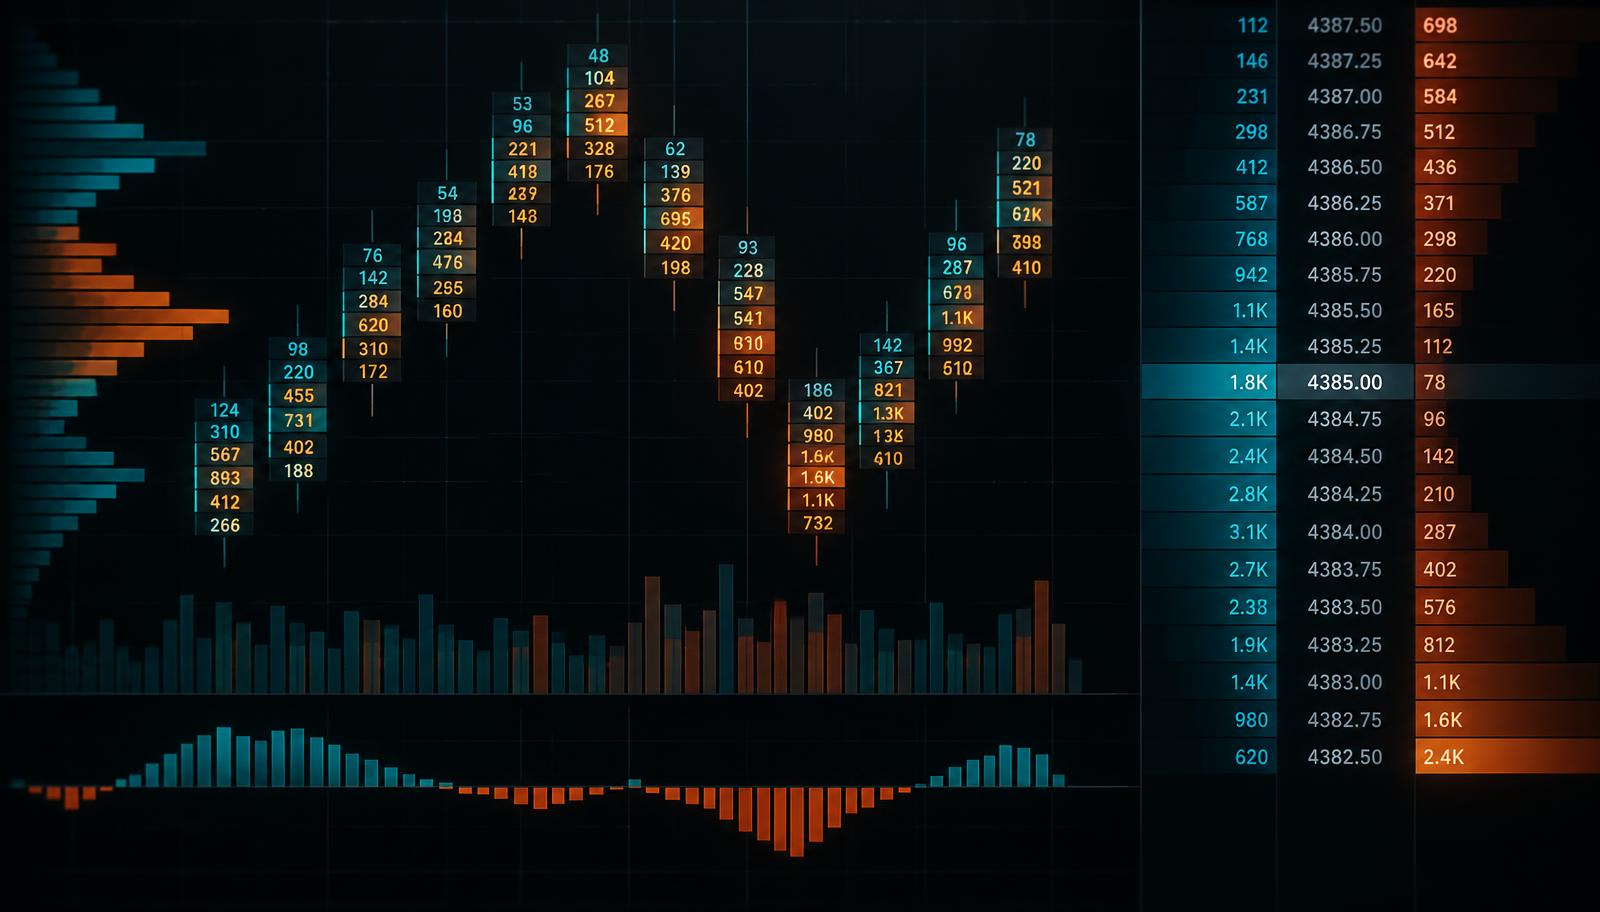
An order flow chart keeps that detail. Instead of one bar, you see the individual transactions stacked at each price: how much was bought at the ask, how much was sold at the bid, how much size was resting in the book and whether it was actually filled or quietly pulled.
That difference matters most at the edges of a move. Two candles can look identical and mean opposite things — one built on steady two-sided participation, the other on a thin sweep that nobody defended.
The core chart types — DOM, footprint, delta, volume profile
Order flow analysis isn't one chart, it's a small toolkit. The four you'll see most often:
- DOM (depth of market) — the live ladder of resting bids and offers around the current price. It shows intent that has not been executed yet, which is also why it can be faked.
- Footprint / cluster chart — each candle is opened up to show buy and sell volume traded at every price inside it. This is where absorption and imbalance become visible.
- Delta — the running difference between market buying and market selling. Cumulative delta plots that difference across the session, so you can compare aggression against the price it produced.
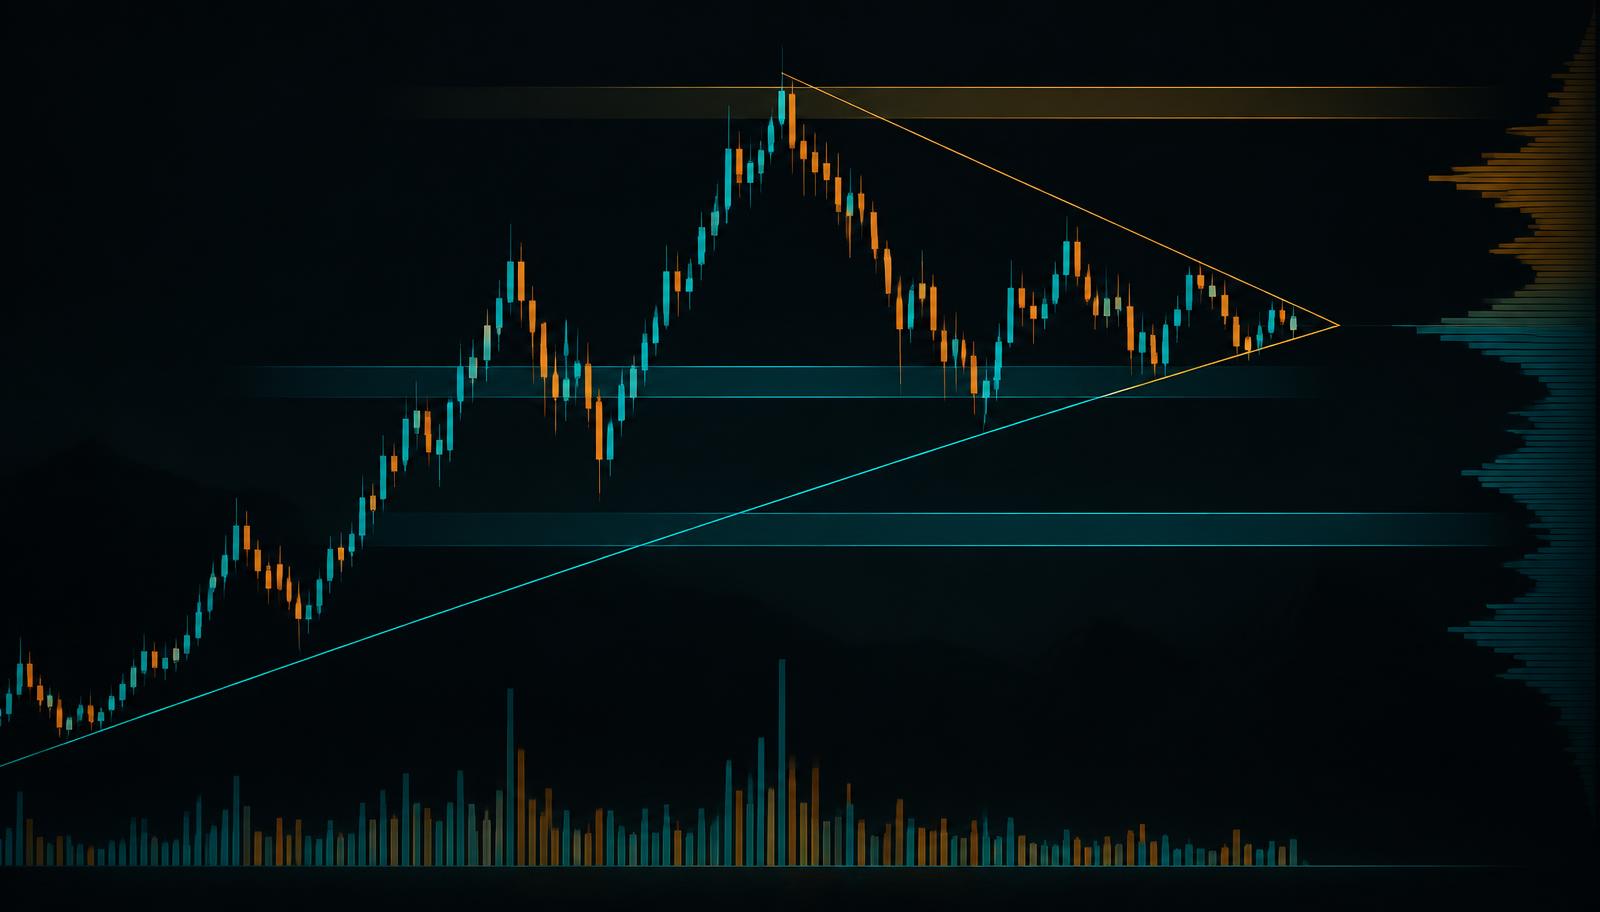
- Volume profile — volume distributed by price rather than by time. High-volume nodes mark prices the market agreed on; low-volume nodes mark prices it rejected quickly.
Most reads use two of these together. A footprint tells you what happened at a level, a volume profile tells you whether that level mattered in the wider session.
What liquidity and absorption mean, in plain English
Liquidity is simply how much size is available to trade against. Thick liquidity means large orders can fill without moving price much; thin liquidity means a modest order can travel a long way.
Absorption is what happens when persistent aggressive buying or selling hits a level and price does not move. Someone is taking the other side in volume. The tell is a mismatch: heavy delta in one direction, almost no price progress in that direction.
The mirror image is exhaustion — aggression that produces one last spike and then immediately fails, with volume drying up behind it.
Absorption is a conversation. One side keeps shouting; the other side keeps calmly answering. The interesting part is who stops first.
Why order flow matters more than price alone
Price tells you what happened; order flow tells you who is doing it and how convicted they are — which is why traders use it to spot traps before price confirms them. A stop hunt, a spoofed wall or an iceberg refill all look like ordinary candles after the fact, but they leave clear fingerprints in the tape while they are forming. If you want to practise that kind of read on captured screenshots, the Shield order flow reader walks through the same liquidity map, trap call and checklist step by step.
Common order flow chart mistakes beginners make
- Reading the DOM as truth. Resting orders can be cancelled in milliseconds. Treat the book as intent, not commitment.
- Chasing delta. A large positive delta with no upward progress is a warning, not a buy case.
- Ignoring context. The same absorption means different things at the session high, at a high-volume node and in the middle of a range.
- Too many windows. Two panels you understand beat six you glance at.
- Skipping the invalidation. If you cannot say what would prove the read wrong, you do not have a read.
Practising order flow reading without risking real capital
Order flow is a pattern-recognition skill, and pattern recognition needs repetition more than it needs capital. Replay a session, pause at each turning point, write down what you think the tape is saying, then let it play and check yourself.
Do that for a few weeks and the language stops feeling foreign. You stop reading numbers and start reading behaviour.
Try Shield free — upload your first order flow screenshot
Capture a DOM, footprint or delta view and let Shield map the liquidity, name the pattern and explain the reasoning in plain language. Educational analysis only — never a trade signal.