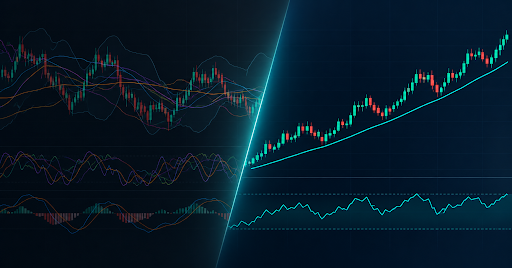
Open a typical beginner's chart and you'll often find five or six indicators layered on top of each other — a couple of moving averages, an RSI, a MACD, maybe a Bollinger Band for good measure. Most of this isn't adding information. It's adding noise dressed up as thoroughness, and it usually produces conflicting signals that leave the trader more confused than if the chart were blank.
This guide cuts through that. It covers what chart indicators actually do, which ones earn a place on a chart, and which are better left off entirely.
Why indicator overload hurts decision-making more than it helps
Every indicator is a derivative of price and volume, calculated differently but ultimately drawing from the same underlying data. Stack enough of them together and you're not getting more information, you're getting the same information repeated in different visual forms, some of it contradicting the others purely due to how each is calculated.
The practical cost shows up in decision-making. When five indicators disagree, a trader has to pick which one to believe, often unconsciously choosing whichever supports the trade they already wanted to take. Fewer, well-understood indicators produce clearer decisions than many poorly-understood ones.
The core categories — trend, momentum, volatility, volume
Nearly every indicator falls into one of four categories, and understanding this makes indicator selection far simpler:
- Trend indicators — moving averages, ADX — show the direction and strength of the prevailing move.
- Momentum indicators — RSI, MACD, Stochastic — measure the speed and change of price movement, often used to spot potential exhaustion or divergence.
- Volatility indicators — Bollinger Bands, ATR — show how much price is moving, useful for setting stops and targets relative to current conditions.
- Volume indicators — On-Balance Volume, VWAP — show the conviction behind a move based on how much was actually traded.
A well-built indicator stack usually pulls no more than one, at most two, from each category, rather than stacking several from the same category that are all measuring a similar thing in slightly different ways.
A minimal indicator stack that covers most trading styles
A genuinely useful, non-cluttered setup might look like:
- One trend indicator — a moving average (20 or 50-period, depending on timeframe) to establish direction.
- One momentum indicator — RSI or MACD, not both, to gauge strength and spot divergence.
- One volatility reference — ATR, used for stop placement rather than as a signal generator.
- Volume or VWAP, particularly for intraday trading, to confirm whether a move has real participation behind it.
That's four indicators total, each answering a distinct question, rather than eight indicators partially answering the same one. This is usually enough for most trading styles, with the chart's own price action and structure doing the rest of the work.
Indicators that sound useful but rarely add real signal
A few indicators are popular despite adding limited practical value for most traders:
- Multiple moving averages of similar length (e.g., 20, 21, and 22-period) — these produce nearly identical lines and add clutter without meaningfully different information.
- Overly complex custom indicators promising a single "buy/sell" signal — these often hide the underlying calculation, making it hard to understand why a signal fired, which matters when deciding whether to trust it.
- Lagging indicators used for entries rather than confirmation — many popular indicators are inherently lagging, which makes them better suited to confirming an already-forming move than to generating early entries.
None of these are inherently useless, but they tend to add complexity without a proportional increase in decision quality, which is the real test any indicator should pass before earning a permanent spot on a chart.
What an order flow chart shows that indicators can't
Indicators are all derived from price and volume after the fact, useful, but always a step removed from the activity producing them. An order flow chart shows the underlying transactional activity directly, revealing where liquidity is resting and how aggressively it's being absorbed, which is why some traders treat it as a complement to indicators rather than a replacement for them.
This distinction is worth understanding even if you don't trade order flow directly, because it explains a limitation indicators share: they describe what has already happened in price, while order flow shows activity closer to real time. Neither replaces the other, and combining structure, a small set of indicators, and order flow context tends to produce a more complete read than any single layer alone.
How to test whether an indicator is actually adding value to your process
Before keeping an indicator on your chart long-term, it's worth testing whether it's genuinely improving decisions:
- Remove it for a week and trade or paper-trade your usual setups without it. Note whether decision quality noticeably changes.
- Check for redundancy. If two indicators on your chart almost always agree, one of them isn't adding new information.
- Review whether it changes your decision, not just your confidence. An indicator that makes you feel more certain about a trade you'd have taken anyway isn't adding real value.
- Backtest it specifically, rather than assuming it works because it's widely used — popularity isn't evidence of edge.
An honest answer to "would my results actually change without this indicator?" is often the fastest way to simplify an overcrowded chart.
TickForge is free to start. Analyse any chart with AI Lens for a clean structural read, or review order flow context with Shield, without needing to stack half a dozen indicators to get a clear picture.
Analyse your first chart free with AI Lens →
FAQ
- What are the best chart indicators for beginners?
A simple starting stack of one trend indicator (such as a moving average), one momentum indicator (RSI or MACD), and a volatility reference like ATR for stop placement covers most of what a beginner needs. Adding more indicators beyond this often creates conflicting signals rather than clearer ones.
- How many indicators should I use on a trading chart?
Most experienced traders use somewhere between two and four indicators, each measuring something distinct — trend, momentum, volatility, or volume — rather than several indicators from the same category that largely repeat the same information in different forms.
- Do chart indicators actually predict price movement?
Chart indicators are calculated from historical price and volume data, which makes most of them inherently lagging to some degree. They're generally more reliable for confirming an already-forming move or gauging conditions like momentum and volatility than for predicting future price movement outright.
- What's the difference between leading and lagging indicators?
Lagging indicators, such as moving averages, are based on past price data and tend to confirm trends after they've already begun. Leading indicators, such as certain momentum oscillators, attempt to signal potential turning points earlier, though they also tend to produce more false signals as a trade-off.
- Is order flow better than traditional chart indicators?
Order flow and traditional indicators serve different purposes rather than one simply being better. Indicators summarize price and volume history, while order flow shows real-time transactional activity. Many traders use both together, with indicators providing broader context and order flow adding real-time granularity.