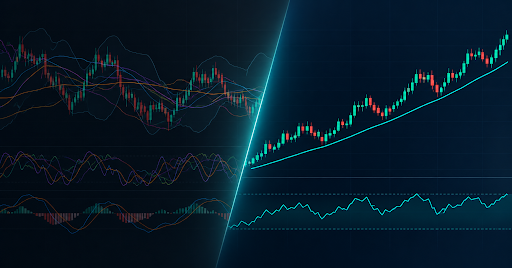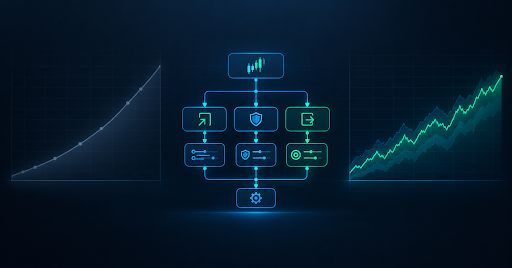
Traders talk about "models" constantly, and the word means something different depending on who's using it. To a quantitative fund it's a statistical system with hundreds of inputs. To a discretionary trader it's a short set of rules about when to buy or sell. To a beginner it's often a vague idea of "something that works."
This guide cuts through the vocabulary. It explains what trading models are, the main types, how to test one honestly, why a perfect backtest is often a warning sign, and how to compare two models fairly. It's educational, not investment advice, and no model guarantees results.
What a trading model is, and how it differs from a setup or a strategy
A trading model is a structured, rule-based description of how you make trading decisions: what conditions trigger an entry, how risk is controlled, and when a position is closed. The key word is structured. A model can be written down precisely enough that someone else could apply it and reach the same decisions.
The terms overlap, but a useful way to separate them is by scope:
- A setup is a specific pattern or condition that produces a trade signal.
- A model combines one or more signals with explicit rules for risk, sizing and exits, so it can be tested as a complete unit.
- A strategy is the broader plan, including which markets and timeframes you trade, how you allocate capital across models and how you behave when conditions change.
In practice people use the words interchangeably. What matters is whether your idea is defined tightly enough to test.
The main types of trading models
Most models fall into a few families, each built on a different belief about how prices behave:
- Trend-following models assume that moves tend to persist. They try to enter once a trend is established and stay until it breaks. They often win less than half the time but make up for it with large winners.
- Mean-reversion models assume that prices stretch too far and snap back toward an average. They tend to win often with small gains, but a single strong trend against them can cause large losses.
- Breakout and momentum models look for price leaving a range or accelerating with volume, betting that the move will continue.
- Order-flow-based models use transactional information such as volume at price, delta and absorption to judge who is in control, usually on short timeframes.
- Statistical and quantitative models use mathematical relationships, such as correlations between instruments, to identify opportunities systematically.
No family is superior. Each works in some conditions and struggles in others, which is why understanding the assumption behind a model matters more than its name.
How to test a model honestly
A backtest is only as trustworthy as the process behind it. A few principles separate useful tests from flattering ones:
- Define every rule before testing. If you adjust rules while looking at results, you're fitting the model to the past, not testing it.
- Use enough trades. A few dozen trades can look impressive purely through luck. Aim for a sample large enough to include winning streaks, losing streaks and different market conditions.
- Include realistic costs. Commissions, spreads and slippage can turn a profitable-looking model into a losing one, particularly for short-term strategies.
- Test out of sample. Build the model on one period of data, then test it on data it has never seen. If performance collapses, it was fitted to the original period.
- Check across regimes. A model that only works in strong uptrends hasn't been proven. See how it behaves in ranges, downtrends and high-volatility periods.
- Look at drawdown, not just profit. Ask how deep and how long the worst losing period was, and whether you could realistically sit through it.
A useful summary statistic is expectancy, the average amount you expect to make per trade: (win rate × average win) − (loss rate × average loss). A positive expectancy after costs, on a decent sample, is the minimum bar. It still isn't proof of a lasting edge.
Overfitting: why a perfect backtest is often a warning sign
Overfitting happens when a model is tuned so tightly to past data that it captures noise rather than a genuine pattern. The result is a beautiful backtest and poor live performance.
Warning signs include:
- Too many parameters. The more settings you can tweak, the easier it is to find a combination that fit the past by chance.
- Extremely smooth equity curves that look too good to be real, especially with few losing trades.
- Fragile settings. If changing a parameter slightly, say from 20 to 22, wrecks the results, the edge probably isn't robust.
- Complex filters added after the fact to remove specific losing trades from the history.
- Strong results in one narrow period only.
A good model usually looks a little boring in a backtest: modest results that hold up across periods, instruments and small parameter changes. Robustness beats perfection.
What tools cost: understanding trading pricing before you commit
You don't need an expensive stack to start testing models. TickForge's free plan covers the basics, and its trading pricing only scales if you outgrow it, so you can find out whether model testing suits your style before spending anything.
When you're comparing tools more generally, look at the full picture rather than the headline price. That means the cost of market data, any charges for historical depth or higher-frequency testing, limits on the number of tests you can run, and whether you'd have to pay again for features you only need occasionally. The cheapest tool that lets you test your rules honestly is usually better than an expensive platform you use for a fraction of its features.
How to compare two models fairly
Comparing models is where many traders fool themselves. To keep it honest:
- Use identical data and time periods for both, including the same costs and slippage assumptions.
- Compare trade counts. A model with 400 trades is far more reliable than one with 40, even if the smaller sample looks better.
- Look at several metrics together: expectancy, profit factor, maximum drawdown, average trade duration and the longest losing streak.
- Check risk-adjusted performance, not only total return. A model that earns slightly less with far smaller drawdowns may suit you better.
- Test robustness, nudging parameters to see which model degrades more gracefully.
- Consider correlation. Two models that make and lose money at the same time add less diversification than two that behave differently.
- Match the model to your temperament. A model with long losing streaks is only useful if you'll actually follow it through them.
The goal isn't to crown the "best" model. It's to understand each model's behaviour well enough to know what you're getting.
TickForge is free to start. Build your rules, run them through the strategy simulator and see win rate, expectancy and drawdown before committing real capital.
Backtest your first model free →
FAQ
- What is a trading model?
A trading model is a structured set of rules describing when to enter a trade, how to manage risk and when to exit. It's defined precisely enough to be tested on historical data and applied consistently, rather than relying on gut feel in the moment.
- What's the difference between a trading model and a trading strategy?
A trading model usually refers to the specific rule set that produces trades, including entry, exit and risk rules. A trading strategy is broader, covering which markets and timeframes you trade, how you allocate capital across models and how you adapt to changing conditions. The terms are often used interchangeably.
- What are the most common types of trading models?
The main families are trend-following, mean-reversion, breakout and momentum, order-flow-based and statistical or quantitative models. Each rests on a different assumption about how prices behave, and each performs better in some market conditions than others.
- How do I know if my trading model is overfitted?
Warning signs include a very smooth backtest, many adjustable parameters, results that collapse when settings change slightly, and strong performance in only one narrow period. Testing on data the model hasn't seen, and checking robustness across conditions, helps reveal overfitting.
- How many trades do I need to trust a backtest?
There's no single number, but dozens of trades are rarely enough. Larger samples, ideally hundreds of trades spanning different market conditions, give a far more reliable picture. Even then, a good backtest doesn't guarantee future performance.
- Do I need to code to build and test a trading model?
Not necessarily. Some traders write custom code, but many modern strategy simulators let you define entry, stop and target rules through a simple interface and run the test automatically. This article is educational and is not investment advice.